Every few weeks, we run a quick check to make sure nothing we've done in development has negatively impacted the performance of our Veracity Learning product. This is important, because a quick test with a few thousand xAPI statements is not enough to get a real sense of the system's capability. Last weekend, I wondered, "how far can we push it?". We wrote a quick script that generated batches of xAPI statements and posted them to an LRS. Each statement is fairly large - they use the SCORM profile so each one is about 1.8 kilobytes of data. The test script sends them in batches of random size, but usually in the ballpark of five statements per xAPI POST.
One goal of this test was to check our ability to run multiple copies of the LRS software on a single virtual machine. With some web server architectures, this is transparent, and you'll use every core in a multicore computer. Node.JS, on which Veracity Learning is based, requires some special configuration to achieve this same goal. We used the process manager PM2, which can launch a Node application in cluster mode. If your application is designed properly, this should be totally transparent. Veracity Learning is careful to use a "stateless" design, so this worked perfectly.
To run this test, we installed Veracity Learning on an Amazon Web Services m5.4xlarge virtual machine. You can check out the stats of the computer here. This is a pretty big server, but by no means is it out of the ordinary. It has 16 processor cores and 64 gigabytes of memory, and can be had for a few hundred dollars a month. We also reserved a terabyte of disk space to hold all the data.
I should note here that this is a fairly naive installation - we're running the web server and the database on the same virtual machine! Even so, the numbers we came up with were impressive.
After a few hours of processing, we reached 41 million statements.
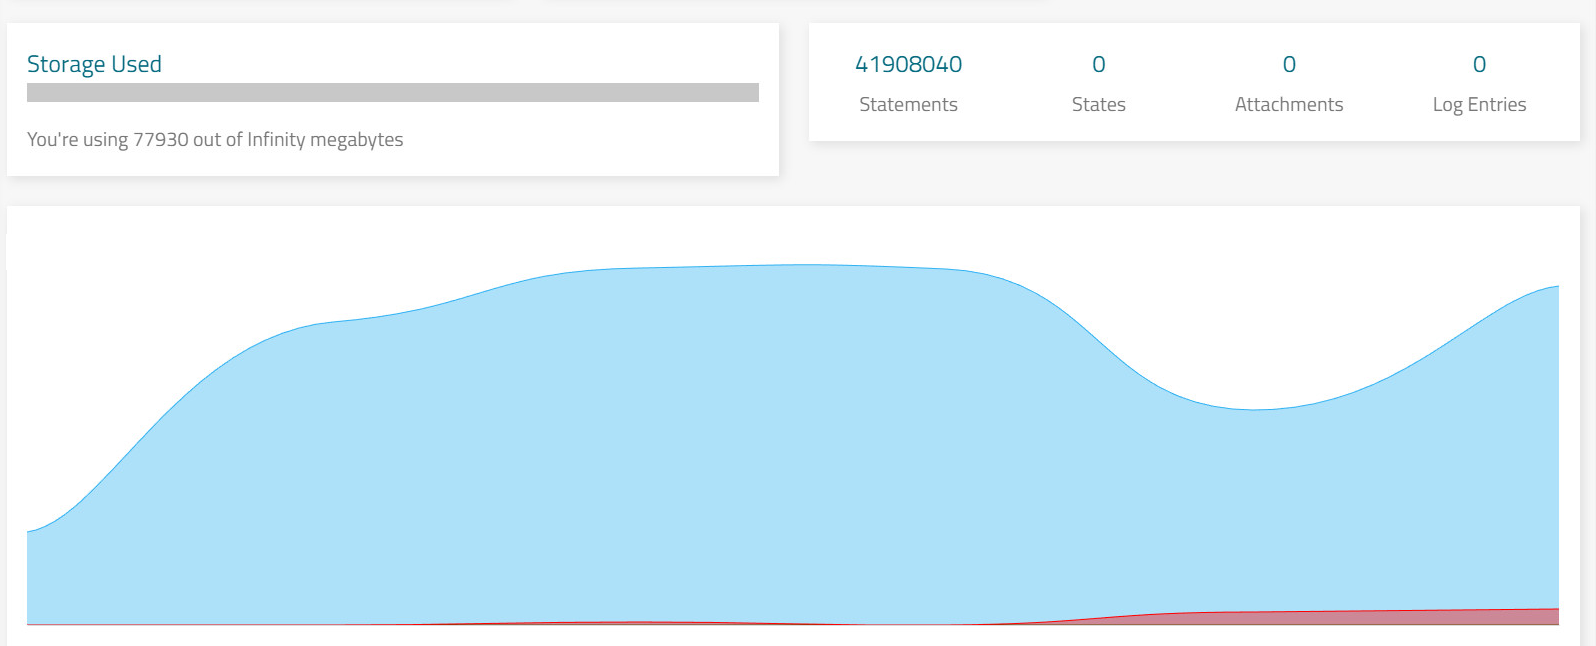
Looking at the stats - we're inserting about 3,000 xAPI statements per second. Here's a screen grab of Mongostat, showing about 10 seconds of inserts. It seemed to run near this speed indefinitely.

Honestly, I expected this server to be faster than this. Two or three thousand statements per second is about what I can achieve with a single processor running Veracity Learning on my development machine. What's the bottleneck here?
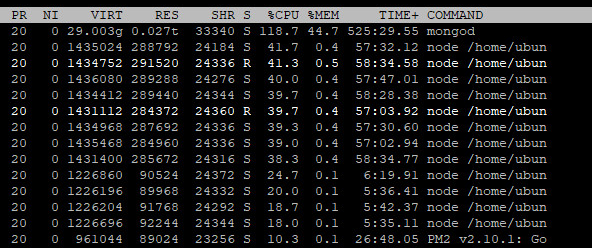
It's pretty clear from the "% CPU" column here that we're not stressing this VM too much. CloudWatch shows us overall that the CPU is running at about 45%. In this shot you can see the MongoDB process on top, and eight workers for the Veracity Learning software, and four workers sending statements. So, we've got CPU power to spare! Maybe we're simply not generating enough statements to stress the machine? Since it does take some time for the statement generators to do their work, we turned up the xAPI statement batch size. Previously, each HTTP post to the xAPI sent an average of five statements. What if we make that average 20?

Here, you can see that we've really improved things! We're sending fewer batches per second, but the batches are bigger, giving us an overall boost to about 6,000 xAPI statements every second. This is getting better! We can even pull up the visualization package and explore the data. Check out the scale on these graphs! The user interface remained snappy and responsive all throughout the test.
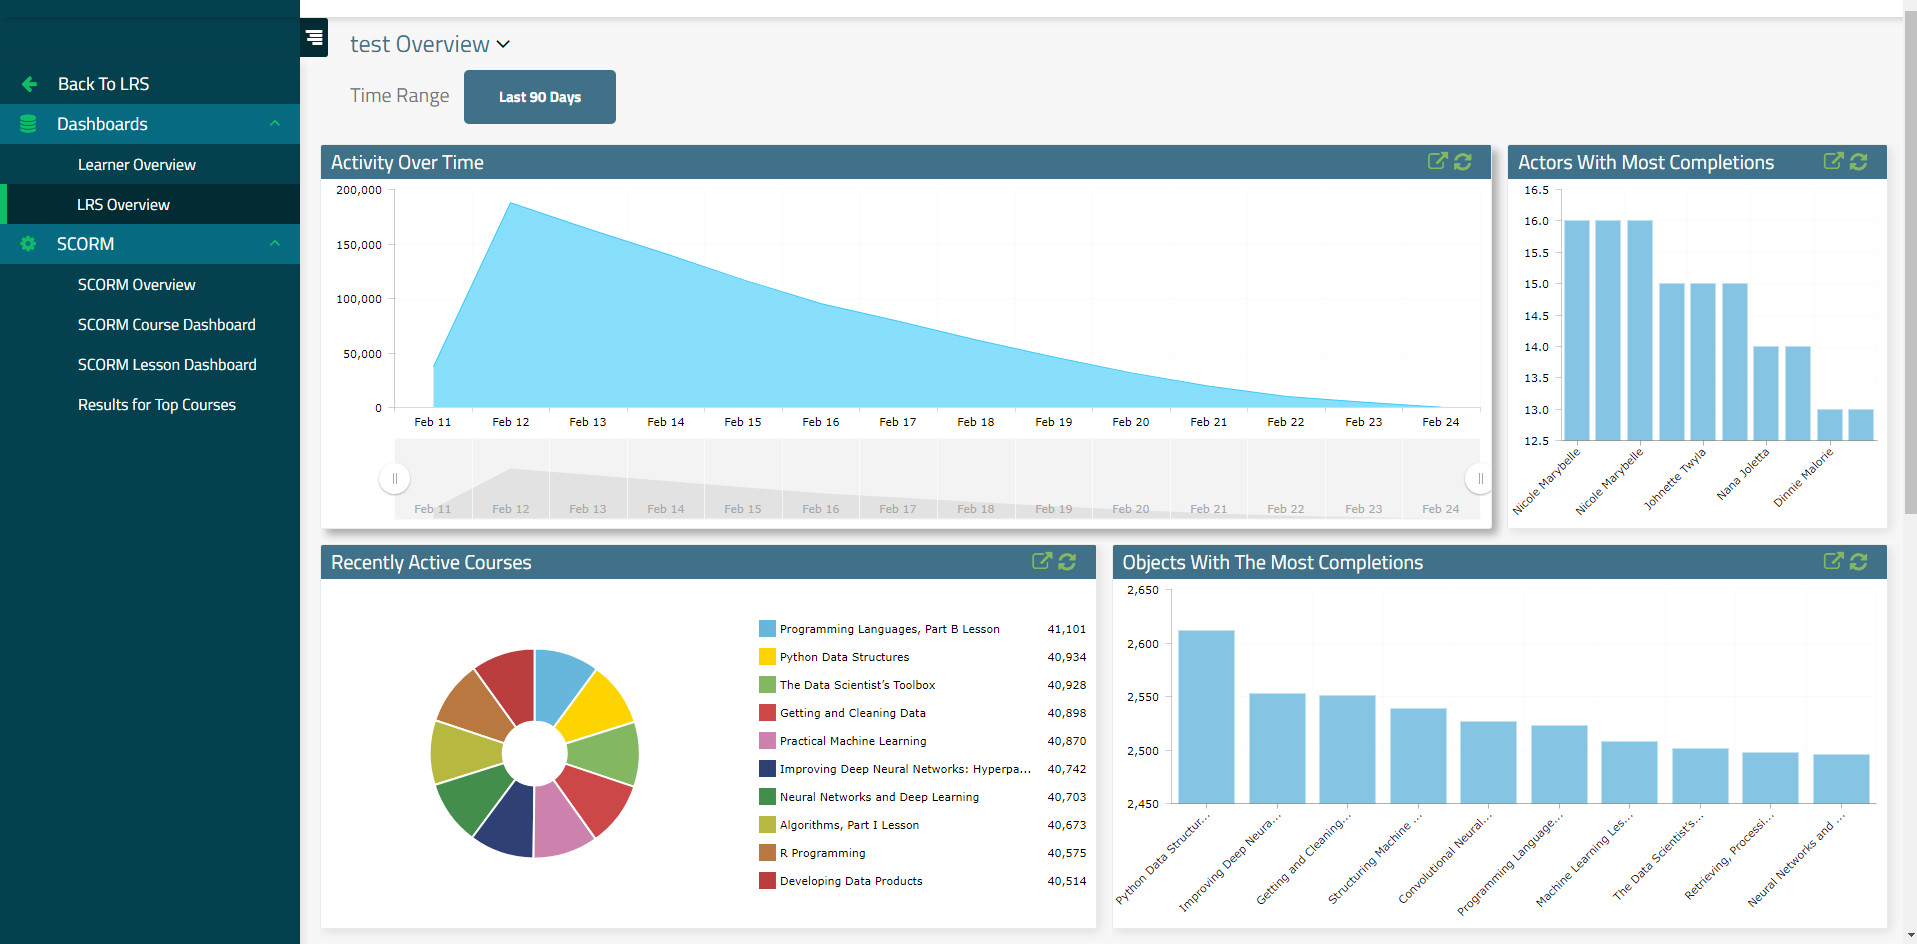
Still - something is not right here. This server is a lot bigger than my development box, but the performance does not seem to be scaling linearly with the number of processors. What could be wrong? There's a clue in the data above...

What the heck!? It's almost like we're reading more xAPI statements than we're writing! This is cool - it looks like we could be answering about 10,000 queries per second even while receiving 6,000 statements. But... this was not part of the plan. There should be many fewer queries than statements stored!
Lo and behold - we've found a real bug, which was the whole point of this exercise. After some digging, it turns out that we are fetching each xAPI statement from the database after it's stored. This was part of our xAPI forwarding feature, where the statements can be sent on to another LRS. We have no upstream LRSs configured, so we should not be reading the statements back. After some refactoring of the forwarding code, we find:

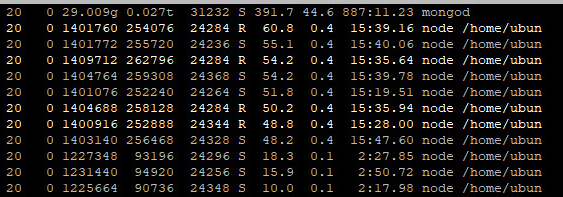
Now we're cooking! At this point, we're writing about 11,000 xAPI statements per second! You can clearly see in the stats that we are starting to stress the server more. Notice how the database CPU is at nearly 400%.
Also, disk speed is becoming an issue. You can see here from the AWS monitor that our disk is working super hard.
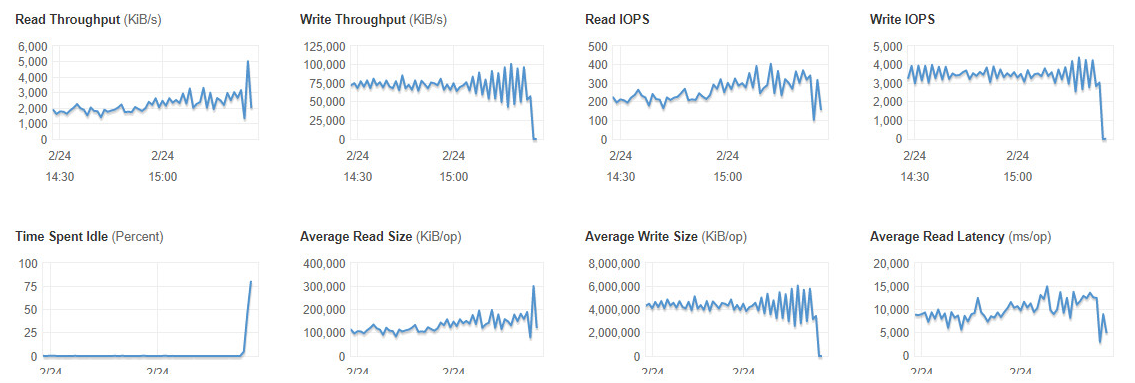
It was getting pretty late, so we decided to let it run overnight, and check back in the morning.
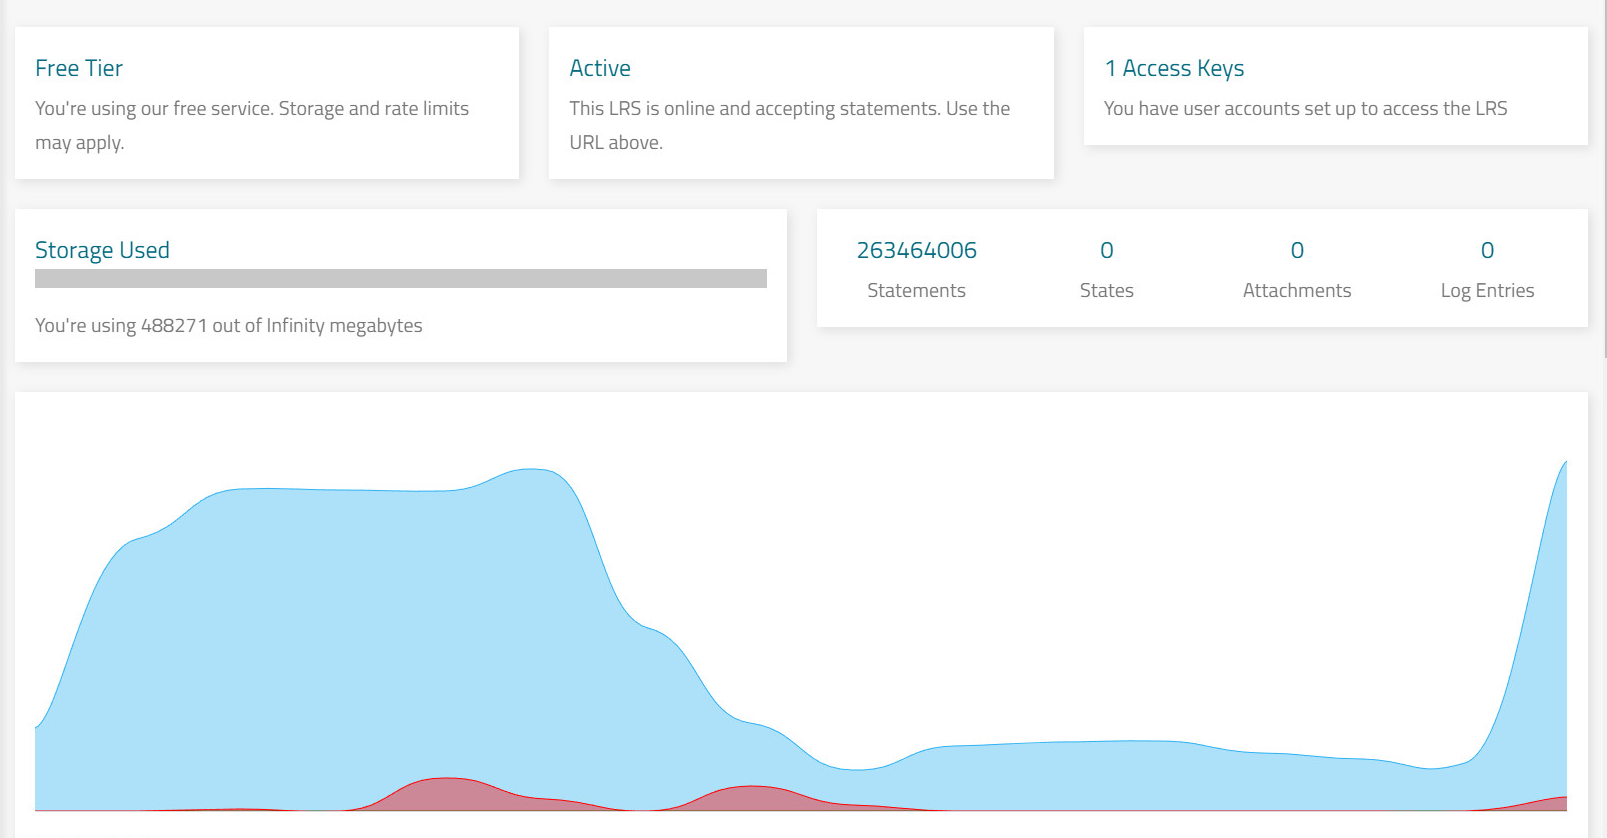
Awesome! The test ran for another 10 hours, and generated 263 million xAPI statements in the SCORM profile. This is a huge number by any standard! There were a few interesting events over night - somehow the write speed dropped slightly. Nevertheless, we were able to maintain at minimum 8,000 statements per second every second for 10 hours straight. Here's the final breakdown from the test
- Statement size averaged 1.855 kb
- We generated 263,464,006 statements
- We stored 61 gigabytes on the disk.
- After fixing the readback issues, we averaged 8,333 statements per second.
It seems there must be some compression on the disk. Note that we have various bits of overhead in our database schema, so it's hard to guess exactly how much storage a single statement requires. Just for fun I ran some numbers: this system would generate about 259 billion statements a year, requiring about 487 terabytes of storage.
So, even with a pretty naive install, on only moderately powerful hardware, we will be able to service tens of thousands of active users. This of course does not take into account backups and such, but even so, this will scale.
Back in my ADL days, I was always annoyed to hear "xAPI won't scale." Next time: shooting for 1 billion.


